
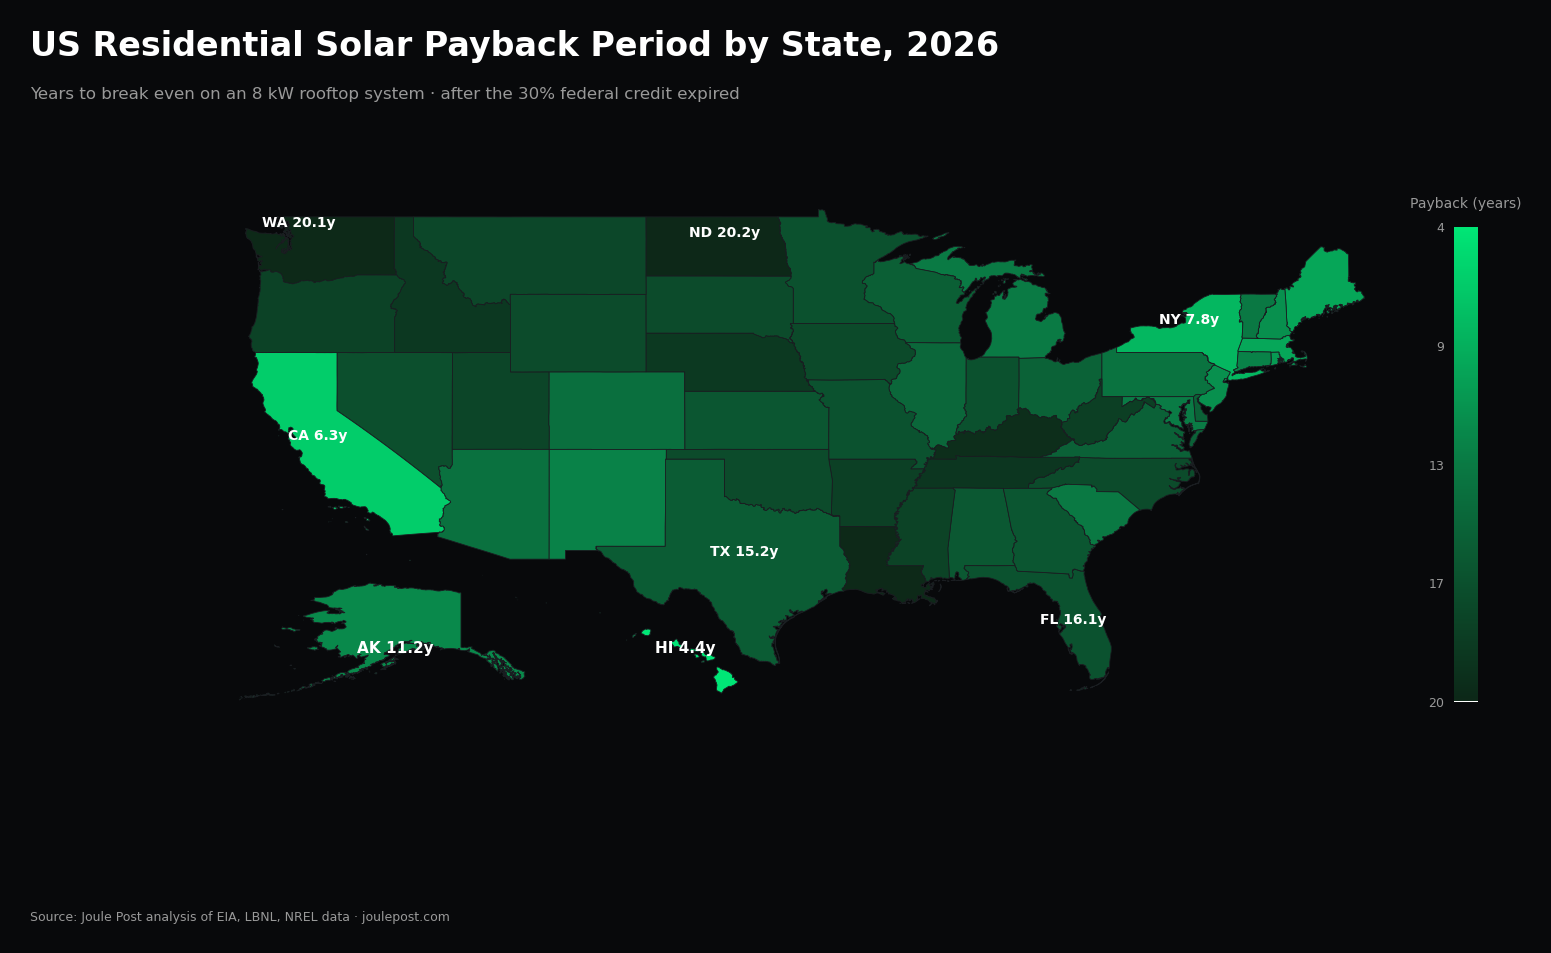
Updated October 18, 2026: This ranking has been rebuilt with per-state data on all four inputs — EIA electricity rates, EIA small-scale solar yield, state-level installed costs, and 11 quantified state incentives. The previous version used a flat national cost assumption. Median payback is now 16.9 years on a 7 kW system with no federal credit.
- Hawaii pays back a home solar system in 4.5 years. North Dakota takes 28.6. The gap is driven by electricity rates, not sunshine.
- We rebuilt our 50-state ranking with per-state data on all four inputs: EIA electricity rates, EIA small-scale solar yield, state-level installed costs, and 11 states’ quantified incentives.
- The median state now needs 16.9 years to break even on a 7 kW system with no federal credit, up from about 8 to 10 years when the 30% credit applied.
Solar payback period: The number of years it takes for a home solar system’s electricity-bill savings to equal its net installed cost after incentives. It is calculated as net system cost divided by first-year bill savings, and it ignores financing costs, panel degradation, and future rate changes.
The 30% credit is gone. Here is what changed
On December 31, 2025, the 30% federal residential solar tax credit, Section 25D of the tax code, expired for homeowner-owned systems. The One Big Beautiful Bill Act, signed July 4, 2025 as Public Law 119-21, repealed it outright for any installation completed after that date, with no phase-down. Under the Inflation Reduction Act, the credit had been scheduled to run at 30% through 2032. Instead it went from 30% to zero in a single day for anyone paying cash or financing with a loan. A separate commercial credit, Section 48E, survives for leased and power-purchase-agreement systems, where the third-party owner claims it.
For a typical 7 kW installation at roughly $4.00 per watt, the installed price is about $28,000. The expired credit would have returned $8,400 of that. Its disappearance is the single largest change to residential solar economics in over a decade, and it turns the buy-or-wait decision into a state-level question. Your payback now depends almost entirely on three local variables: what your utility charges per kilowatt-hour, how much sun your roof gets, and whether your state still offers its own incentives.
This is the second edition of our 50-state payback ranking. The first edition, published October 12, 2026, modeled an 8 kW system at a single national price. This update rebuilds the ranking from per-state data on every input: actual state residential electricity rates from the U.S. Energy Information Administration, state-level solar yield derived from EIA generation data, state-varying installed costs anchored to Lawrence Berkeley National Laboratory’s measured medians, and dollar-quantified state incentives where they exist. The result moves several states significantly. Rhode Island, for example, jumps into second place once its $11,550 state grant is counted properly.
How we calculated this
We modeled a 7 kW rooftop system, close to the U.S. residential average. Four per-state inputs feed a simple payback formula.
Installed cost. We used state-level installed prices per watt. Eleven states have published medians from Lawrence Berkeley National Laboratory’s Tracking the Sun 2025 Data Update, which measured a national median of $4.00 per watt for 2024 installations. For the remaining 39 states we used modeled state values from the EcoGen Solar Cost Index of September 2026, rescaled so the national level matches LBNL’s measured $4.00 per watt. This keeps one consistent method for state-to-state variation while anchoring the absolute level to the best primary-source national figure. Installed prices, not marketplace quotes: EnergySage’s quoted prices run 25 to 40% below what homeowners actually pay, so quotes would understate payback everywhere.
Electricity rate. Each state’s average residential rate comes from the EIA’s Electric Power Monthly, Table 5.6.A, for June 2026, the latest month with a complete 50-state table at the time of analysis. Rates range from 13.49 cents per kilowatt-hour in Louisiana to 52.72 cents in Hawaii. These are statewide averages across utilities and rate structures, not any single household’s posted rate.
Annual production. Instead of using one national production figure or broad regional bands, we derived each state’s annual kilowatt-hours per installed kilowatt from EIA data: 2024 estimated small-scale solar generation divided by average small-scale solar capacity for that state. EIA builds these generation estimates with NREL’s PVWatts and System Advisor Model tools, so the figures reflect real-world tilt, orientation, and age mixes rather than optimal lab conditions. Values run from 1,003 kWh per kW per year in Alaska to 2,033 in New Mexico. We then applied a uniform 15% loss factor for inverter losses, soiling, shading, and non-optimal orientation, stated here explicitly.
State incentives. We quantified dollar-value state incentives for a 7 kW system where they exist with clear terms: tax credits as a percentage of cost, per-watt rebates, and performance payments such as renewable energy certificates. Eleven states clear $1,000. The largest are Illinois at about $13,690 in combined rebates and certificate payments, Rhode Island at about $11,550 from its Renewable Energy Fund grant, and New Jersey at about $9,700 in certificate value. Certificate lifetime totals are nominal and undiscounted. Where incentive terms were ambiguous across sources, we marked the figure estimated and used the conservative reading.
The formula: payback in years equals net system cost (7,000 watts times dollars per watt, minus state incentives) divided by annual bill savings (7,000 times state kWh per kW per year times 0.85, times the residential rate). Net metering policy affects how much of that production actually offsets bills at the full retail rate, and we recorded each state’s policy, but the headline ranking uses gross bill savings so states remain comparable. Nine states now use net billing with reduced export rates, five have no statewide net metering policy at all, and the economics in those states are worse than the table suggests for households that export a large share of production.
The 50-state ranking
Ranked by estimated simple payback period for a 7 kW system in 2026, with no federal tax credit. All figures use June 2026 EIA residential rates.
| Rank | State | Avg $/W | Avg ¢/kWh | Est. payback (years) |
|---|---|---|---|---|
| 1 | Hawaii | 4.35 | 52.72 | 4.5 |
| 2 | Rhode Island | 3.75 | 29.23 | 6.6 |
| 3 | Massachusetts | 3.74 | 29.61 | 8.0 |
| 4 | California | 4.36 | 34.74 | 8.1 |
| 5 | New Jersey | 4.04 | 24.95 | 8.8 |
| 6 | New York | 3.98 | 29.49 | 9.2 |
| 7 | Illinois | 4.22 | 19.89 | 10.3 |
| 8 | Maine | 4.22 | 29.59 | 11.4 |
| 9 | New Hampshire | 4.04 | 27.01 | 12.2 |
| 10 | Delaware | 3.18 | 19.29 | 13.1 |
| 11 | Maryland | 3.88 | 21.84 | 13.1 |
| 12 | Connecticut | 3.75 | 24.32 | 13.2 |
| 13 | New Mexico | 3.75 | 15.06 | 13.3 |
| 14 | Arizona | 3.62 | 15.18 | 13.8 |
| 15 | Vermont | 4.03 | 24.44 | 14.3 |
| 16 | South Carolina | 3.94 | 15.55 | 14.8 |
| 17 | Wisconsin | 3.73 | 19.56 | 14.9 |
| 18 | Texas | 3.46 | 15.94 | 15.0 |
| 19 | Mississippi | 3.58 | 14.88 | 15.4 |
| 20 | Michigan | 4.28 | 22.99 | 15.7 |
| 21 | Georgia | 3.85 | 16.36 | 16.1 |
| 22 | Colorado | 4.18 | 17.13 | 16.2 |
| 23 | Virginia | 3.86 | 17.22 | 16.2 |
| 24 | Missouri | 3.79 | 16.22 | 16.4 |
| 25 | Oklahoma | 3.65 | 14.33 | 16.7 |
| 26 | Nevada | 3.71 | 13.11 | 16.9 |
| 27 | Ohio | 3.83 | 19.19 | 17.5 |
| 28 | Kansas | 3.97 | 15.71 | 17.6 |
| 29 | Pennsylvania | 3.97 | 21.73 | 17.9 |
| 30 | North Carolina | 3.82 | 14.74 | 18.0 |
| 31 | Alaska | 4.36 | 28.21 | 18.1 |
| 32 | Indiana | 4.11 | 17.51 | 18.3 |
| 33 | Arkansas | 3.54 | 14.12 | 18.4 |
| 34 | Oregon | 3.90 | 16.32 | 18.5 |
| 35 | Florida | 4.08 | 15.10 | 18.6 |
| 36 | Louisiana | 3.72 | 13.49 | 18.7 |
| 37 | Kentucky | 3.67 | 14.26 | 19.2 |
| 38 | Minnesota | 4.30 | 17.52 | 19.3 |
| 39 | Montana | 3.78 | 15.14 | 19.3 |
| 40 | Idaho | 4.10 | 14.37 | 19.6 |
| 41 | South Dakota | 3.94 | 15.36 | 19.8 |
| 42 | Wyoming | 4.35 | 15.24 | 19.9 |
| 43 | Alabama | 4.76 | 16.40 | 20.0 |
| 44 | West Virginia | 4.06 | 15.45 | 20.2 |
| 45 | Iowa | 4.25 | 15.93 | 20.4 |
| 46 | Utah | 4.17 | 13.37 | 20.5 |
| 47 | Nebraska | 4.03 | 13.25 | 21.6 |
| 48 | Tennessee | 4.40 | 14.07 | 21.9 |
| 49 | Washington | 3.96 | 14.91 | 23.0 |
| 50 | North Dakota | 4.69 | 14.12 | 28.6 |
Sources: residential rates from EIA Electric Power Monthly Table 5.6.A (June 2026); solar yield derived from EIA Electric Power Annual 2024 small-scale generation and capacity; installed costs from LBNL Tracking the Sun 2025 and the EcoGen Solar Cost Index rescaled to LBNL’s $4.00/W national median; state incentives from DSIRE and state program administrators. Full per-state data and sources in the downloadable dataset accompanying this article.
The 5 fastest-payback states, and why
Hawaii, 4.5 years. No other state is close. Hawaii’s residential rate of 52.72 cents per kilowatt-hour is the highest in the nation by a wide margin, and its solar yield of 1,795 kWh per kW per year is excellent. A 7 kW system there offsets roughly $6,400 a year in bills against a net cost under $26,000 after the state’s $5,000 income tax credit. High rates plus strong sun is the unbeatable combination, and Hawaii has both.
Rhode Island, 6.6 years. The surprise of this edition. Rhode Island’s sun is mediocre and its 29.23-cent rate, while high, does not explain second place alone. What does: the state’s Renewable Energy Fund grant, worth about $11,550 on a 7 kW system at $1.65 per watt, which cuts the net system cost nearly in half. Note the caveat: published caps on the grant conflict across sources, ranging from $5,000 to $14,500, so treat this figure as the optimistic reading and confirm current terms before quoting it.
Massachusetts, 8.0 years. Cloudy Massachusetts beating sunny Arizona is the finding that surprises newcomers every year, and the math is simple: electricity at 29.61 cents versus 15.18 cents. Each kilowatt-hour a Massachusetts system produces is worth nearly twice as much. Add the state’s SMART 3.0 performance payments plus a $1,000 tax credit, worth about $6,040 combined on a 7 kW system, and the Bay State lands third despite middling sunshine.
California, 8.1 years. California pairs the second-highest rate in the ranking at 34.74 cents with strong production of 1,829 kWh per kW per year. It would rank higher if not for two drags: the highest installed costs in the country at $4.36 per watt, and net billing under NEM 3.0, which pays only about 5 to 8 cents for exported kilowatt-hours instead of the full retail rate. Households that consume most of their solar output directly do far better than the headline number suggests. Our NEM 3.0 explainer walks through the self-consumption math.
New Jersey, 8.8 years. The Garden State’s combination of a 24.95-cent rate and about $9,700 in SREC-II certificate value over 15 years puts it fifth. New Jersey is a case study in how performance-based incentives substitute for the lost federal credit: the certificates pay per megawatt-hour produced, rewarding actual generation rather than installed capacity.
The 5 slowest-payback states, and why
North Dakota, 28.6 years. The longest payback in the nation, and it is not close. North Dakota combines a low 14.12-cent rate, modest solar yield, the highest modeled installed cost in the ranking at $4.69 per watt, and no state incentives. At these economics, a system barely breaks even within its warrantied life. North Dakota is the clearest case where waiting for costs to fall, or for state policy to change, beats buying now.
Washington, 23.0 years. Washington’s problem is cheap, abundant hydropower: at 14.91 cents, there is simply not much bill to offset, and Seattle’s clouds hold yield to 1,358 kWh per kW per year. The state’s past incentive programs have wound down. Solar in Washington remains an environmental choice more than a financial one.
Tennessee, 21.9 years. The Tennessee Valley Authority’s low rates flow through to a 14.07-cent residential average, and there is no statewide net metering mandate, which further weakens the economics for systems that export. Modest sun and no state incentives complete the picture.
Nebraska, 21.6 years. Public power keeps Nebraska’s rate at 13.25 cents, among the lowest in the country. With no state incentives and average Plains sunshine, the math does not work without the federal credit. Nebraska illustrates the broader pattern across the bottom ten: cheap grid power is the binding constraint, not clouds.
Utah, 20.5 years. Utah has good sun at 1,794 kWh per kW per year, but the nation’s second-lowest rate at 13.37 cents means each of those kilowatt-hours is worth little. Utah is the mirror image of Massachusetts: sunshine cannot compensate for cheap electricity.
Why the credit’s end regionalized solar: rates vary 4×, sunshine only 2×
The end of the 30% credit did not kill residential solar. It regionalized it. In Hawaii, Rhode Island, and Massachusetts, the financial case remains strong on rates and state incentives alone. In roughly half the states, payback now stretches past 16 years, which exceeds many homeowners’ planning horizons and most loan terms. The industry consequence is already visible: with 92% of installers telling EnergySage that losing the credit would harm their business, expect consolidation toward high-rate states and a shift in sales pitches from tax savings to bill savings.
Electricity price matters more than sunshine. The five fastest states average 34 cents per kilowatt-hour; the five slowest average 14 cents. A system’s value is rate times production, and rates vary fourfold while production varies only twofold. Second, state incentives now do the work the federal credit did, but only in about eleven states, and their terms change frequently. Illinois’s combined $13,690 in certificate and rebate value is the largest in the nation, yet it depends on utility territory. Third, net metering policy is the quiet variable. Twenty-seven states still offer full retail-rate net metering, but nine have moved to reduced export rates and five have no statewide policy. In net-billing states, the table’s payback figures are optimistic for households that export heavily; pairing solar with a home battery to shift consumption changes the math substantially.
For readers weighing a purchase, the single most useful number is your own utility’s rate, not your state’s average. If you pay well above your state average on a time-of-use plan, your payback will beat this table. If you are considering a lease instead of a purchase, note that third-party-owned systems can still access the federal 48E commercial credit, which is why lease quotes in 2026 often look better than purchase quotes. Our guide on whether solar is worth it after the credit ended covers the buy-versus-lease tradeoff in detail.
Frequently asked questions
Is residential solar still worth it in 2026 without the federal tax credit?
It depends on your state. In Hawaii, Rhode Island, Massachusetts, California, and New Jersey, payback runs under 9 years on rates and state incentives alone, which remains a solid investment. In about half the states, payback exceeds 16 years, which is a harder sell. Check your utility rate first: it is the biggest single driver. Our net metering explainer covers how export rules affect the math.
Which state has the fastest solar payback in 2026?
Hawaii, at an estimated 4.5 years for a 7 kW system. Its 52.72-cent residential rate is the highest in the nation, and its solar yield is excellent. No other state is within two years of it.
Why does cloudy Massachusetts beat sunny Arizona for solar payback?
Because a solar system’s value equals its production times your electricity rate, and rates vary far more than sunshine does. Massachusetts pays 29.61 cents per kilowatt-hour versus Arizona’s 15.18 cents, so each unit of solar electricity is worth nearly twice as much. Add Massachusetts’s SMART performance payments and the gap widens further. Learn how solar panels convert that sunlight and why the rate multiplier dominates.
Which states still offer solar incentives in 2026?
Eleven states offer incentives worth more than $1,000 on a typical 7 kW system. The largest are Illinois (about $13,690 in certificates and rebates), Rhode Island (about $11,550 in grants), New Jersey (about $9,700 in certificates), Massachusetts (about $6,040), and South Carolina (about $5,250 in tax credits). Terms change frequently; confirm with your state energy office before signing a contract.
How accurate is this 50-state ranking?
It is an estimate built from the best public data available, not a quote. Installed costs for 39 states are modeled values rescaled to Lawrence Berkeley National Laboratory’s measured national median; electricity rates are EIA statewide averages, not your utility’s specific tariff; and solar yield is derived from EIA’s modeled small-scale generation data. Real quotes vary with roof complexity, installer, and equipment. Use the ranking to compare states, then get local quotes for your address. The full per-state dataset and every source are published alongside this article so anyone can check the work.