
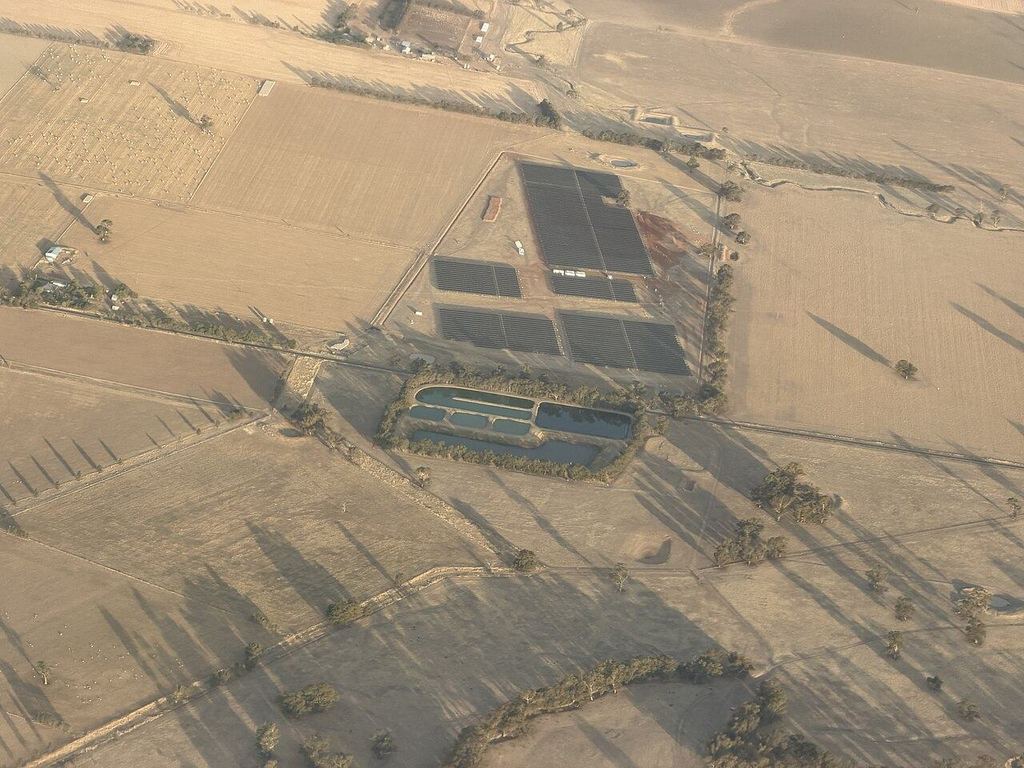
- Deriva Energy closed approximately $540 million in debt for its 350 MW Sullivan County Power Project in Indiana, announced 22 October 2026, its largest construction project to date.
- The five-bank club deal works out to $1.54 million of debt per MW, and the implied all-in build cost sits 30 to 52 percent above the national median, depending on the assumed debt share.
- Indiana is becoming one of the fastest-growing utility solar states in the US, which makes Sullivan County a useful test case for where project costs are heading in 2026.
Deriva Energy has closed a financing of approximately $540 million for its 350 MW solar project in Sullivan County, Indiana, the largest single project the North Carolina-based developer has built to date. Announced on 22 October 2026, the debt package funds a solar PV farm already under construction. Earlier in October Deriva also closed a $280 million financing for a 302 MW battery project in Oklahoma, according to PV Tech’s report on the deal.
Divide $540 million of debt by 350 MW of capacity and you get $1.54 million of debt per megawatt. This article does the arithmetic the announcement leaves out: what that implies for the project’s true build cost, how it compares with the latest national cost data from Lawrence Berkeley National Laboratory, and what it says about financing a large solar farm in Indiana in 2026.
How five banks backed a 350 MW solar project
The financing was arranged by Deriva Energy’s Capital Markets team as a five-bank club deal. The five-bank club includes RBC, DNB Bank ASA, Mizuho Bank, National Westminster Bank and Wells Fargo Securities, with RBC serving as administrative agent and collateral agent. Skadden acted as borrower’s counsel and Milbank as lenders’ counsel, as set out in Construction Review’s write-up of the announcement.
Paul Tivnan, Deriva Energy’s chief financial officer, said in the announcement: “We are pleased to close this financing for Sullivan County Power. This is our 350 MW solar project currently under construction in Indiana. The project’s quality and financing attributes resulted in strong demand from top-tier relationship banks and competitive terms. Moreover, we look forward to working together to bring Sullivan County Power to completion.”
The deal adds to a portfolio of roughly 7 GW of wind, solar and storage assets in operation or under construction across major US power markets for the Brookfield portfolio company. Earlier in October, Deriva closed $280 million for the Frontier Energy Storage project, a 302 MW standalone battery system in Kay County, Oklahoma, which will be sold to Oklahoma Gas and Electric on completion. Thomas Hopkins, Deriva’s head of capital markets and treasury, said in the announcement that the structure “builds on financing structures we have successfully utilized across our portfolio and provides a framework we can apply to our extensive development pipeline.”
| Financing detail | Term |
|---|---|
| Debt raised | Approximately $540 million |
| Project | Sullivan County Power Project, Sullivan County, Indiana |
| Technology and capacity | Utility-scale solar PV, 350 MW |
| Structure | Five-bank club deal, arranged by Deriva’s Capital Markets team |
| Administrative and collateral agent | Royal Bank of Canada (RBC) |
| Lenders | RBC, DNB Bank ASA, Mizuho Bank, National Westminster Bank, Wells Fargo Securities |
| Borrower’s counsel | Skadden |
| Lenders’ counsel | Milbank |
| Status | Under construction; largest project built by Deriva to date |
The arithmetic: $1.54 million of debt per MW
The announced $540 million is debt, not total project cost. Utility-scale solar projects are typically financed with a mix of debt and equity, so the all-in build cost is higher than the debt number alone. The announcement does not disclose Deriva’s debt share, so this article runs the numbers across a standard range.
Utility solar project financings commonly carry debt at around 60 to 70 percent of total project cost. Apply that range to Sullivan County: at 60 percent debt, the implied all-in cost is $900 million, or $2.57 million per MW; at 70 percent debt, it is $771 million, or $2.20 million per MW. Those figures are this article’s arithmetic, not disclosed facts. They assume the debt is sized against the 350 MW project alone.
The natural benchmark is Lawrence Berkeley National Laboratory’s Utility-Scale Solar, 2026 Edition, which compiled data on 1,989 ground-mounted projects larger than 5 MW built through 2025. It puts median installed costs for plants that started up in 2025 at $1.69 per watt-AC, up 2 percent on the year, and the levelized cost of energy at $61/MWh before tax credits. Set against that $1.69 per MW benchmark, Sullivan County’s implied all-in cost lands 30 percent higher under the 70 percent debt assumption and 52 percent higher under the 60 percent debt assumption.
| Cost comparison | $/MW |
|---|---|
| Sullivan County: debt per MW ($540M / 350 MW) | $1.54M |
| Sullivan County: implied all-in at 70% debt (assumed) | $2.20M |
| Sullivan County: implied all-in at 60% debt (assumed) | $2.57M |
| LBNL Utility-Scale Solar 2026: median installed cost, 2025 startups | $1.69M |
| Zelestra Reclamation Solar, Indiana: debt per MW ($350M / 203 MW) | $1.72M |
An Indiana comparison sharpens the picture. Earlier in October, Zelestra closed a $350 million green credit facility for its 203 MW Reclamation Solar project in Gibson County, Indiana, also under construction, according to Solar Now’s report on that deal. That works out to $1.72 million of debt per MW, about 11 percent more debt per megawatt than Sullivan County. Two Indiana solar financings in the same month, both announced in the mid-$1 millions per MW of debt, suggest the Deriva figure is not an outlier for the state.
Why the implied cost runs above the national median
Three caveats keep this analysis honest. First, the LBNL figure is a national median for plants that started up in 2025, and the lab itself notes that cost data for 2024 and 2025 remain preliminary. Second, Deriva’s announced debt may include development costs, interest reserves, contingency, or grid upgrades beyond the modules and steel, which would lift the implied number without the physical build being any more expensive. Third, the debt share assumption matters enormously: if Deriva secured a higher debt percentage than 70 percent, the implied all-in cost converges back toward the national median.
Even so, there are structural reasons an Indiana project in 2026 could cost more than the LBNL median. The lab reports that levelized costs have risen 24 percent since 2022, driven by higher capital and financing costs and by more projects being built in less sunny regions. Indiana falls squarely in that category. Module prices also face Section 232 tariffs on polysilicon, wafers, cells and modules taking effect in December, which LevelTen Energy cited when reporting a 4.9 percent rise in its solar PPA index in the third quarter.
Indiana’s solar buildout gives the numbers context
The project lands in a state where solar is accelerating. Indiana deployed nearly 3 GW of solar in 2025, up from 1.6 GW in 2024, and ranked among the top states for new solar additions, reporting on SEIA’s U.S. Solar Market Insight 2025 Year in Review. For readers weighing how utility-scale project economics translate to household scale, Joule Post’s 2026 cost model comparing solar leases and purchases walks through the same financing logic at rooftop scale.
What $1.54M of debt per MW means for the 2026 solar pipeline
The significance of this deal is less the ribbon-cutting and more the signal it sends to lenders. Five major banks committed to a 350 MW project in a non-traditional solar state in a year when tax-credit uncertainty, tariffs and permitting bottlenecks have all weighed on the industry. “Strong demand from top-tier relationship banks and competitive terms” is the line every developer puts in a release, but the club-deal roster and the size of the commitment give it substance: this is the second nine-figure utility-solar financing in Indiana in October alone, after EnergyRe’s $815 million financing for a 360 MW South Carolina solar project we covered recently.
The cost question remains open and worth watching. If Sullivan County’s all-in build truly runs 30 to 50 percent above the LBNL national median, buyers of its eventual power will need to cover that premium somewhere, through a higher PPA price or a stronger capacity-factor performance in the Indiana sun than the median suggests. Either way, $1.54 million of debt per megawatt is now a public data point against which the next utility solar financing can be measured.